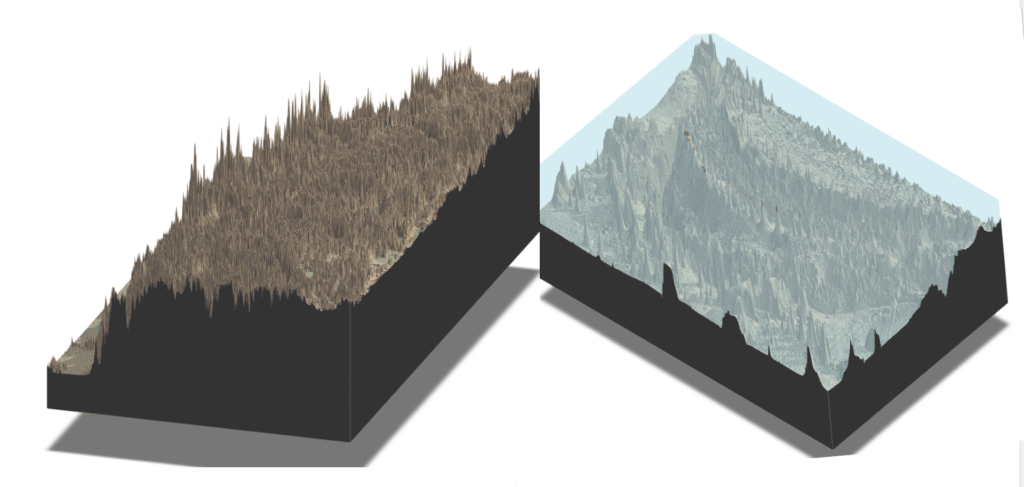
(R, R Coding) Side-by-side 3-D map comparisons of the Himalayas’ mountain ranges and the Mariana Trench’s abyss help us recognize the objective assessments of the planet Earth’s fascinating geographical features.
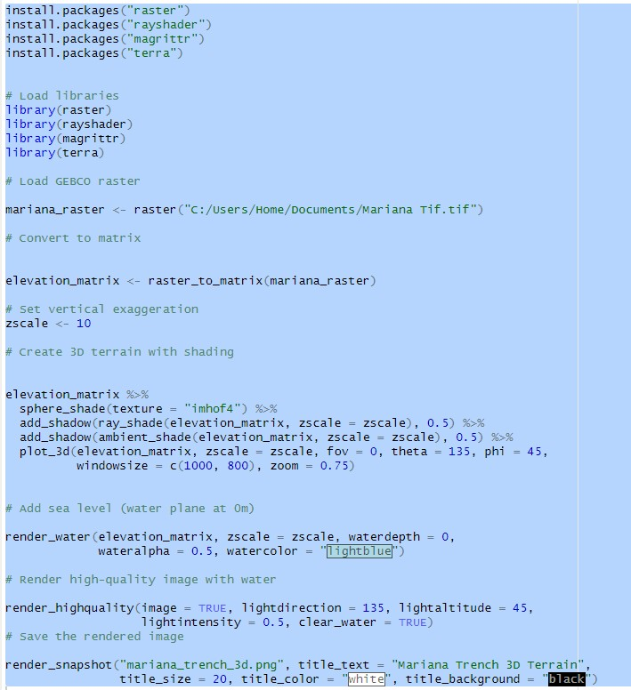
FIRST, A FEW TECHNICAL NOTES: R packages “raster” and “rayshader” are used to create the eye-opening maps. The GEBCO dataset provides the detailed bathymetric data (for the Mariana Trench), and the elevation (above sea level, for the Himalaya Mountains) from NASA SRTM. Fortunately, the highest and lowest locations on Earth are located on similar latitudes, meaning the projected map distortions of the two regions are broadly identical, making the visual map easier to compare. Also, please note that the magnitude of elevation/bathymetry is exaggerated 10 times the actual value to emphasize the visual differences.
My thanks to Mr. Samuel Ohana Grainger of the CUNY Graduate Center for the guidance and encouragement that helped me embark on this fascinating journey.
THE 3-D VISTAS OF THE HIMALAYAS AND MARIANA TRENCH: The actual 3-D maps (the Right map shows the Himalayas, and the left map shows the Mariana Trench, followed by sample R codes that produced the maps).
AMAZING DISCOVERIES (TO ME!):
- Mt. Everest is not a lone high peak, but rather a prominent part of the majestic and vast Himalayas “plateau”, the entirety of which is situated at an extremely high elevation.
- The Mariana Trench is not a deep hole in the flat seabed, but more like a series of colossal underwater mountain ranges. (Notice that a few isolated locations represent relatively tiny islands above the water level.)
THE HIMARAYA MOUNTAIN RANGES (x10 ACTUAL ELEVATION) THE MARIANA TRANCH (x10 ACTUAL DEPTH)

This entry is licensed under a Creative Commons Attribution-NonCommercial-ShareAlike 4.0 International license.