(TABLEAU PUBLIC) USING THE DATA FROM THE NYCOPEN DATA 311 SERVICE REQUESTS, COLLECTION OF (LACK OF) HEAT COMPLAINTS DURING THE FIVE MONTHS PERIODS BETWEEN OCTOBER 2024 AND FEBRUARY 2025 HAVE BEEN ANALYZED USING TABLEAU, THE /INITIAL RESEARCH SHOWS TANTALIZING POSSIBILITY OF IMPROVING THE QUALITY OF LIFE FOR THE RESIDENTS OF NYC, ESPECIALLY FOR THE PEOPLE WHO ARE IN THE BOROUGH OF BRONX.
NYC OpenData makes the public data generated by various New York City Agencies and other City organization available for public use. NYC 311 Data is a subset of NYC OpenData that collects all 311 Service Requests from 2010 to present. It is a huge data set: in 2018, for example, the number of the 311 customer interactions are said to exceed 35 million in 2022!
Here is the first Tableau Public Chart that shows the relationship between the number of heat (or lack thereof) complains to 311 by Borough during the months of October 2024 through February 2025. The no heat complains during these five months exceeded 250,000
The illustrate the impact of ambient temperatures to the complaints, the average day and night temperatures for NYC during these five months are also added.
<script type='text/javascript'> var divElement = document.getElementById('viz1742249718023'); var vizElement = divElement.getElementsByTagName('object')[0]; vizElement.style.width='100%';vizElement.style.height=(divElement.offsetWidth*0.75)+'px'; var scriptElement = document.createElement('script'); scriptElement.src = 'https://public.tableau.com/javascripts/api/viz_v1.js'; vizElement.parentNode.insertBefore(scriptElement, vizElement); </script>There is no surprise that the complains rise as the average temperatures fall. What is less intuitive, however, is that the number of complains appear to rise most, and most noticeably, from the Bronx, the trends become clearer when we see the zip code specific no-heat complains for the months of October 2024 and February 2025.
What is remarkable between the two charts below (October 2024 complaints and January 2025 complains, both charts using the same scale color schemes) is that certain zip codes appear to show dramatic rise in no-heat complains during the “peak/coldest” month of January.
The seriousness of several zip codes areas in Bronx, and one to two zip code regions in Brooklyn, is notable.
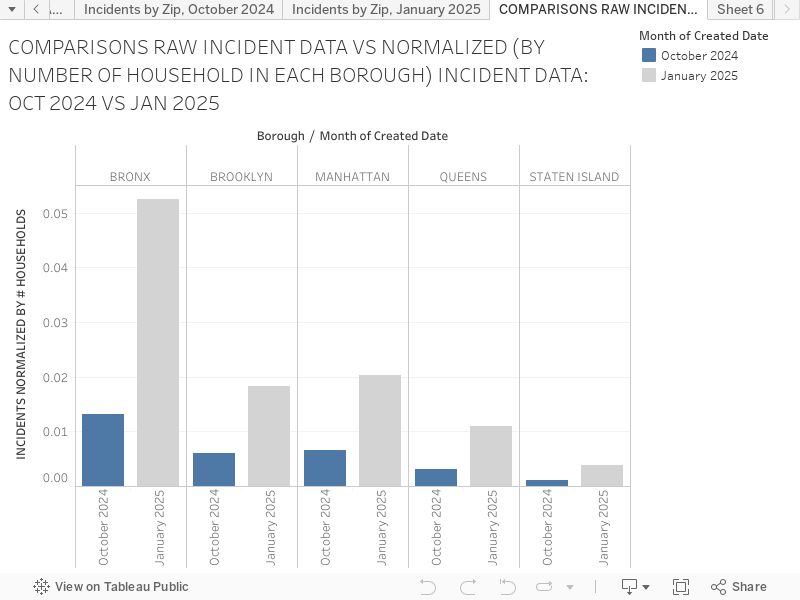
The chart below compares the per household incidences of no-heat complains for October 2024 and January 2025 for each Borough. Here again, the seriousness of the no-heat challenge in the Bronx is easy to see, especially during the peak winter month of January where one in 20 households in Bronx appears to call 311 for the lack of heat problems, while the number is one in 50 or less for other Boroughs.
Why is Bronx showing much more serious no-heat problems for its residents? I plan to address this question sometime in the near future.
<script type='text/javascript'> var divElement = document.getElementById('viz1742317678071'); var vizElement = divElement.getElementsByTagName('object')[0]; vizElement.style.width='100%';vizElement.style.height=(divElement.offsetWidth*0.75)+'px'; var scriptElement = document.createElement('script'); scriptElement.src = 'https://public.tableau.com/javascripts/api/viz_v1.js'; vizElement.parentNode.insertBefore(scriptElement, vizElement); </script>
This entry is licensed under a Creative Commons Attribution-NonCommercial-ShareAlike 4.0 International license.